 Global Grid
Energy week: 6 to 12 April 2026
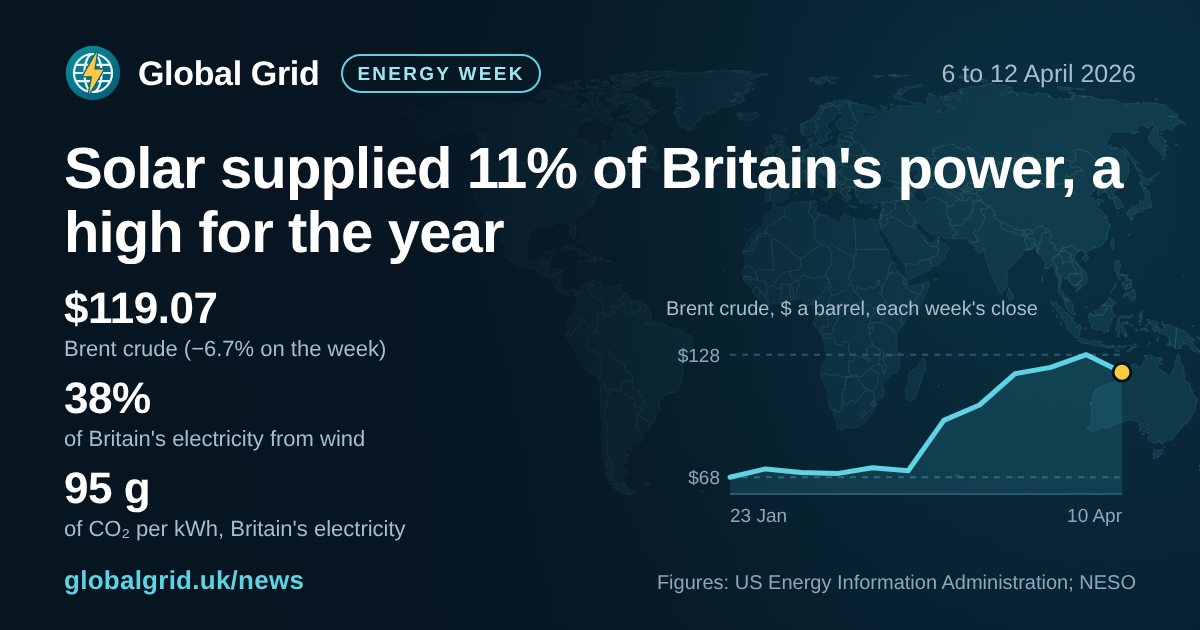
In the week to Sunday 12 April 2026, solar panels supplied 11% of Great Britain's electricity, the most of any week this year and Brent crude fell 6.7% to $119.07 a barrel.
Key figures
- Oil: Brent $119.07 a barrel on 10 April 2026 (−6.7% on the week); WTI $98.34.
- Gas: Henry Hub $2.64 per million British thermal units (−7.7% on the week).
- At the pumps: UK petrol 154.7p and diesel 186.8p a litre; US petrol $4.12 and diesel $5.64 a gallon.
- Britain's electricity: wind 38%, gas 14%, solar 11%; 95 g of CO₂ per kWh (146 a year earlier).
- Cables: Britain imported a net 352 GWh, the most from France.
- US oil: production 13.60 million barrels a day (EIA's weekly estimate); the Strategic Petroleum Reserve 409.2 million barrels (−4.1 million).
Crude oil prices, the last 12 weeks
Britain's electricity this week
- Wind 38%
- Nuclear 16%
- Gas 14%
- Imports 13%
- Solar 11%
- Biomass 4.4%
- Other 1.9%
- Hydro 1.4%
- Storage 0.8%
The week in numbers
| Measure | This week | Week before |
|---|---|---|
| Brent crude, $ a barrel (average) | $124.61 | $123.94 |
| WTI crude, $ a barrel (average) | $104.54 | $105.67 |
| Henry Hub gas, $ per MMBtu (average) | $2.85 | $2.90 |
| UK petrol, pence a litre | 154.7 | 148.8 |
| UK diesel, pence a litre | 186.8 | 176.5 |
| US petrol, $ a gallon | 4.12 | 3.99 |
| Wind, share of Britain's power | 38% | 38% |
| Carbon intensity, g of CO₂ per kWh | 95 | 109 |
| US crude production, m barrels a day | 13.60 | 13.60 |
| US oil reserve, m barrels | 409.2 | 413.3 |
Official news
- Welsh households to save money on bills through heat networks expansionUK Department for Energy Security and Net Zero, 7 April 2026
- Government approves UK’s largest power-producing solar farmUK Department for Energy Security and Net Zero, 8 April 2026
- Hydrogen investment fuels South Yorkshire's next industrial eraUK Department for Energy Security and Net Zero, 9 April 2026
Read more: Britain's electricity in 2026 · Every week
← 30 Mar–5 Apr 2026 · 13–19 April 2026 →
Sources: NESO (Supported by National Energy SO Open Data); US Energy Information Administration (prices, US production, pump prices and the reserve; public domain); Department for Energy Security and Net Zero, weekly road fuel prices (Open Government Licence); Contains BMRS data © Elexon Limited copyright and database right; official news: UK Department for Energy Security and Net Zero (GOV.UK, Open Government Licence v3.0). Written from the published figures on 5 November 2026; figures last updated 16 November 2026. Prices are in US dollars unless shown and are not financial advice.
To cite this page: Global Grid, “Energy week: 6 to 12 April 2026”, globalgrid.uk/news/week/2026-04-06, and the original source named above.